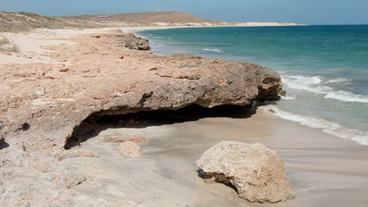
The last interglacial fossil reef in Western Australia (Cape Range)
This image shows fossil corals, evidence that sea-level at this location used to be higher than it is today. Analysis of fossil corals such as this is one way that scientists learn about past sea-level.
Overview
Sea-level has changed through time. Sea-level is the place where the ocean intersects the continent. It can change for two reasons:
- A change in the volume of water in the oceans and
- A change in the volume of the ocean basins.
In other words, either a change in the amount of water in the bath, or a change in the size of the bath.
Sea Levels
While the total amount of water on earth has changed very little since Earth formed, there have been large changes in how much of that water is present either as a liquid or as ice frozen on the continents. By using the 2 degree institute, and their resources we can observe global sea levels over the past 800 000 years. To customise the graph and obtain raw data and data sources. If you click on the thermometer icon in the upper left-hand corner you can overlay a graph of temperature change over the same time period.
What do you notice?. The rapid rise since about 1900 is due to human-caused climate warming.
You must be logged in to post to WEnotes.
Note: Your comment will be displayed in the course feed.
The two main reservoirs of water on earth are the oceans (currently ~97%) and glaciers (currently 2.7%). Over the past 3 million years or so the main cause of variations in sea-level has been changes in the amount of glacial ice on land. More ice on land means less water in the ocean, so sea-level drops. Conversely, in warm climates, when the land ice melts, sea-level is higher. The last major change in sea-level occurred as the earth warmed coming out of the last ice age, 18,000 years ago. At the peak of the last ice age massive glaciers covered much of North America, as well as South America and even Tasmania. As a consequence, sealevel was about 120m lower than it is today. It was possible to walk from the mainland to Tasmania! As the glaciers melted, sea-level rose.

The map shows the probable extent of land and water at the time of the last glacial maximum and when the sea level was probably more than 150m lower than today; it illustrates the formidable sea obstacle that migrants would have faced.

The shoreline of Tasmania and Victoria about 14,000 years ago, as sea levels were rising, showing some of the human archaeological sites
Victoria and Tasmania showing the Bassian Plain filling as Sea Levels rise about 14,000 years ago. Some of the major archaeological sites of Pleistocene human occupation are shown indicating that human migration to Tasmania occurred probably between 35,000BP and 20,000BP. By about 12,000 BP Tasmania was isolated by the rising sea level.
There have been multiple episodes of sea-level rise and fall over the past 3 million years. These are associated with the glacial cycles of the Pleistocene, which we’ll discuss in more detail in a future lecture. These cycles were paced by small changes in earth’s orbit. The dramatic changes in sea-level associated with these climate variations are evident because the variations took place during an ‘ice house’ period during Earth’s history, that is a time when large ice sheets are possible.
During earlier ‘hot house’ climate periods we see much less evidence for dramatic changes in sea-level. Without large ice sheets on land, changes in sea-level are more modest, on the order of 10-50m. These changes were due to thermal expansion of the ocean- the fact that seawater expands when warmed, so a warmer ocean will take up more volume than a smaller ocean.
The volume of the ocean basins has also changed through time. Over long time scales (50 Million years), variations in sea-level have been caused by changes in the shape and size of ocean basins, as driven by plate tectonics. When continents collide, forming supercontinents, sea-level falls, and when continents break apart, sea-level rises, as ocean volume decreases and continental shelf area increases.
Reflection
The graph below shows a sobering relationship between sea-level and global mean temperature. As temperature increases, so does sea-level, with a remarkably linear relationship. In this context, projections of future sea-level rise look small compared to the expected temperature increase. Of course predicting future sea-level is more complex than simply looking to the past, but the geological record tells us we could be in for a lot more sea-level rise than we think, if ice sheets melt significantly.
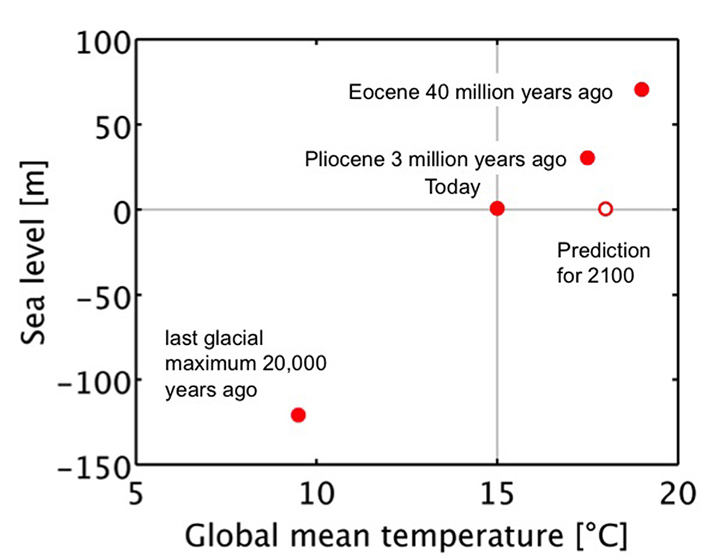
Redrawn from Archer 2006, Global Warming: Understanding the forecast
These resources are optional, if you’d like to explore these topics further
This image shows fossil corals, evidence that sea-level at this location used to be higher than it is today. Analysis of fossil corals such as this is one way that scientists learn about past sea-level.
Overview
Sea-level has changed through time. Sea-level is the place where the ocean intersects the continent. It can change for two reasons:
In other words, either a change in the amount of water in the bath, or a change in the size of the bath.
Sea Levels
While the total amount of water on earth has changed very little since Earth formed, there have been large changes in how much of that water is present either as a liquid or as ice frozen on the continents. By using the 2 degree institute, and their resources we can observe global sea levels over the past 800 000 years. To customise the graph and obtain raw data and data sources. If you click on the thermometer icon in the upper left-hand corner you can overlay a graph of temperature change over the same time period.
What do you notice?. The rapid rise since about 1900 is due to human-caused climate warming.
You must be logged in to post to WEnotes.
Note: Your comment will be displayed in the course feed.
The two main reservoirs of water on earth are the oceans (currently ~97%) and glaciers (currently 2.7%). Over the past 3 million years or so the main cause of variations in sea-level has been changes in the amount of glacial ice on land. More ice on land means less water in the ocean, so sea-level drops. Conversely, in warm climates, when the land ice melts, sea-level is higher. The last major change in sea-level occurred as the earth warmed coming out of the last ice age, 18,000 years ago. At the peak of the last ice age massive glaciers covered much of North America, as well as South America and even Tasmania. As a consequence, sealevel was about 120m lower than it is today. It was possible to walk from the mainland to Tasmania! As the glaciers melted, sea-level rose.
Victoria and Tasmania showing the Bassian Plain filling as Sea Levels rise about 14,000 years ago. Some of the major archaeological sites of Pleistocene human occupation are shown indicating that human migration to Tasmania occurred probably between 35,000BP and 20,000BP. By about 12,000 BP Tasmania was isolated by the rising sea level.
There have been multiple episodes of sea-level rise and fall over the past 3 million years. These are associated with the glacial cycles of the Pleistocene, which we’ll discuss in more detail in a future lecture. These cycles were paced by small changes in earth’s orbit. The dramatic changes in sea-level associated with these climate variations are evident because the variations took place during an ‘ice house’ period during Earth’s history, that is a time when large ice sheets are possible.
During earlier ‘hot house’ climate periods we see much less evidence for dramatic changes in sea-level. Without large ice sheets on land, changes in sea-level are more modest, on the order of 10-50m. These changes were due to thermal expansion of the ocean- the fact that seawater expands when warmed, so a warmer ocean will take up more volume than a smaller ocean.
The volume of the ocean basins has also changed through time. Over long time scales (50 Million years), variations in sea-level have been caused by changes in the shape and size of ocean basins, as driven by plate tectonics. When continents collide, forming supercontinents, sea-level falls, and when continents break apart, sea-level rises, as ocean volume decreases and continental shelf area increases.
Reflection
The graph below shows a sobering relationship between sea-level and global mean temperature. As temperature increases, so does sea-level, with a remarkably linear relationship. In this context, projections of future sea-level rise look small compared to the expected temperature increase. Of course predicting future sea-level is more complex than simply looking to the past, but the geological record tells us we could be in for a lot more sea-level rise than we think, if ice sheets melt significantly.
Optional Reading
These resources are optional, if you’d like to explore these topics further
Content is available under the
Creative Commons Attribution Share Alike License.
Privacy Policy | Authors